Create Fault Traces
With the Create Fault Traces form (model > 3D Structure > Create Fault Traces) you can calculate the exact locations of the horizon-fault intersections in your structural model, and visualize them as lines in various views for QC and mapping purposes. Each fault trace will receive a property fault type (i.e. normal/reverse), fault dip and fault dip direction (i.e. azimuth).
Fault traces should not be confused with fault cutoff lines: where fault cutoff lines are used (by editing) to modify your structural model, fault traces show the resulting horizon-fault intersections after the model has been built. Especially when fault cutoff lines were manually edited, and depending on the extent of these edits, the ultimate horizon-fault intersections can deviate from the fault cutoff line edits (as the the gridder cannot always honor all edits, see Editing fault cutoff lines). To verify, QC or map the final horizon-fault intersections of your structural model, always use fault traces.
To generate fault traces
- Open the Create Fault Traces form, select the structural model and click Apply or OK. Upon clicking, the fault traces are generated for each horizon-fault combination in your structural model.
- The fault traces are stored in the JewelExplorer, under 3D Structural Models > your structural model > Fault Traces, with names based on the intersecting fault and horizon. Per each of these fault traces you find a hanging wall and a footwall fault trace, each of which contains the properties 'Fault type', 'Fault dip' and 'Fault dip azimuth'.
- You can visualize fault traces in the 2D View, 3D View or CoView by checking the checkbox in the JewelExplorer. When you check the box for the footwall or hanging wall fault trace, they are visualized either as a solid line or a dotted line. When you check any of the fault trace properties, the line will show the property classes as colors on the line (see image below).
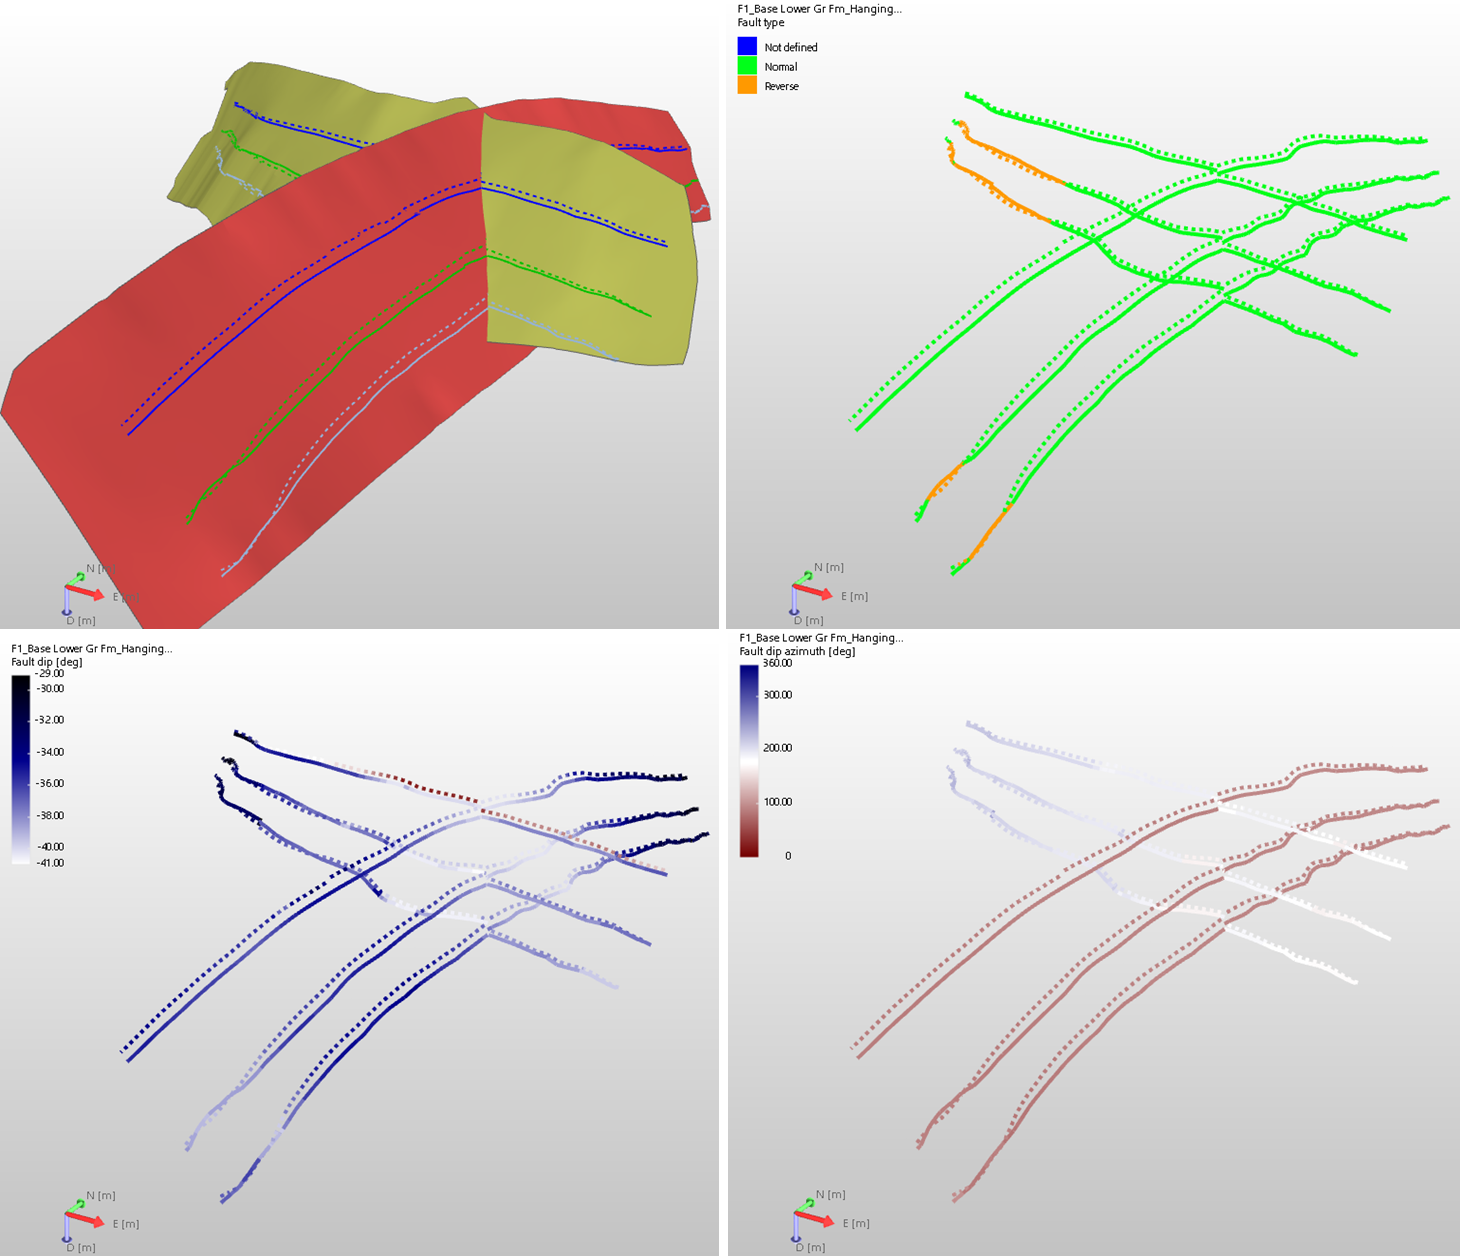
Upper left: Two faults are displayed, together with the fault traces of three intersecting horizons; hanging wall fault traces as solid lines, footwall fault traces as dashed lines. Upper right: The same fault traces, with property 'fault type' checked in the JewelExplorer. Lower left: The same fault traces, with property 'fault dip' checked in the JewelExplorer. Lower right: The same fault traces, with property 'dip azimuth' checked in the JewelExplorer. click to enlarge
Auto-update of fault traces
If you already generated fault traces for a structural model and re-run the construct surfaces step or click Apply/OK on the Fault Cutoff Line Edits form (which also re-constructs the surfaces), any existing fault traces are automatically updated. This way fault traces always stay in sync with your structural model.